Campaign Analytics Dashboard | Content Collaboration Receivables
A 10-page Python and Dash dashboard that turns six years of content collaboration campaigns into collections analytics. Schema normalization across drifting spreadsheet formats, client identity resolution, payment-processor reconciliation, DSO and aging, and seasonality-adjusted forecasting. Runs entirely on the operator's machine.
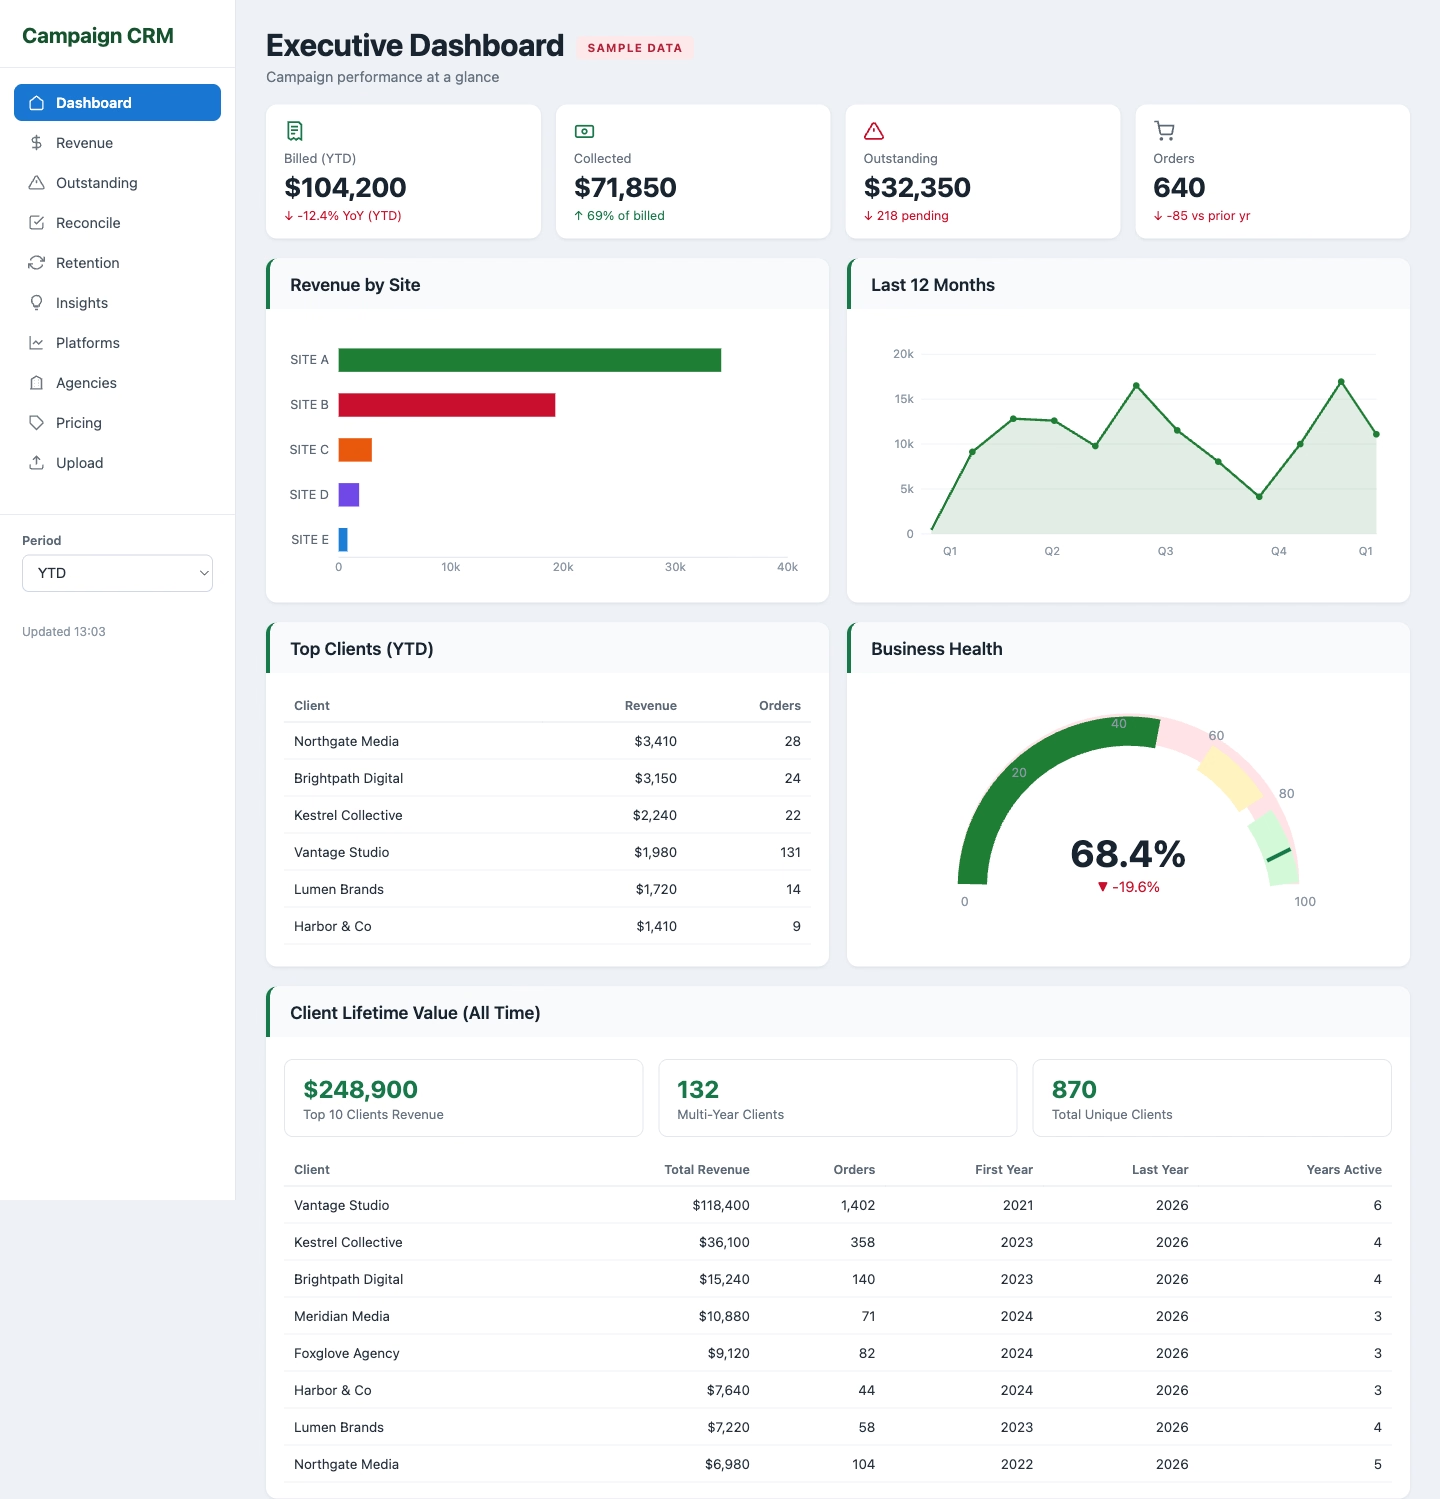
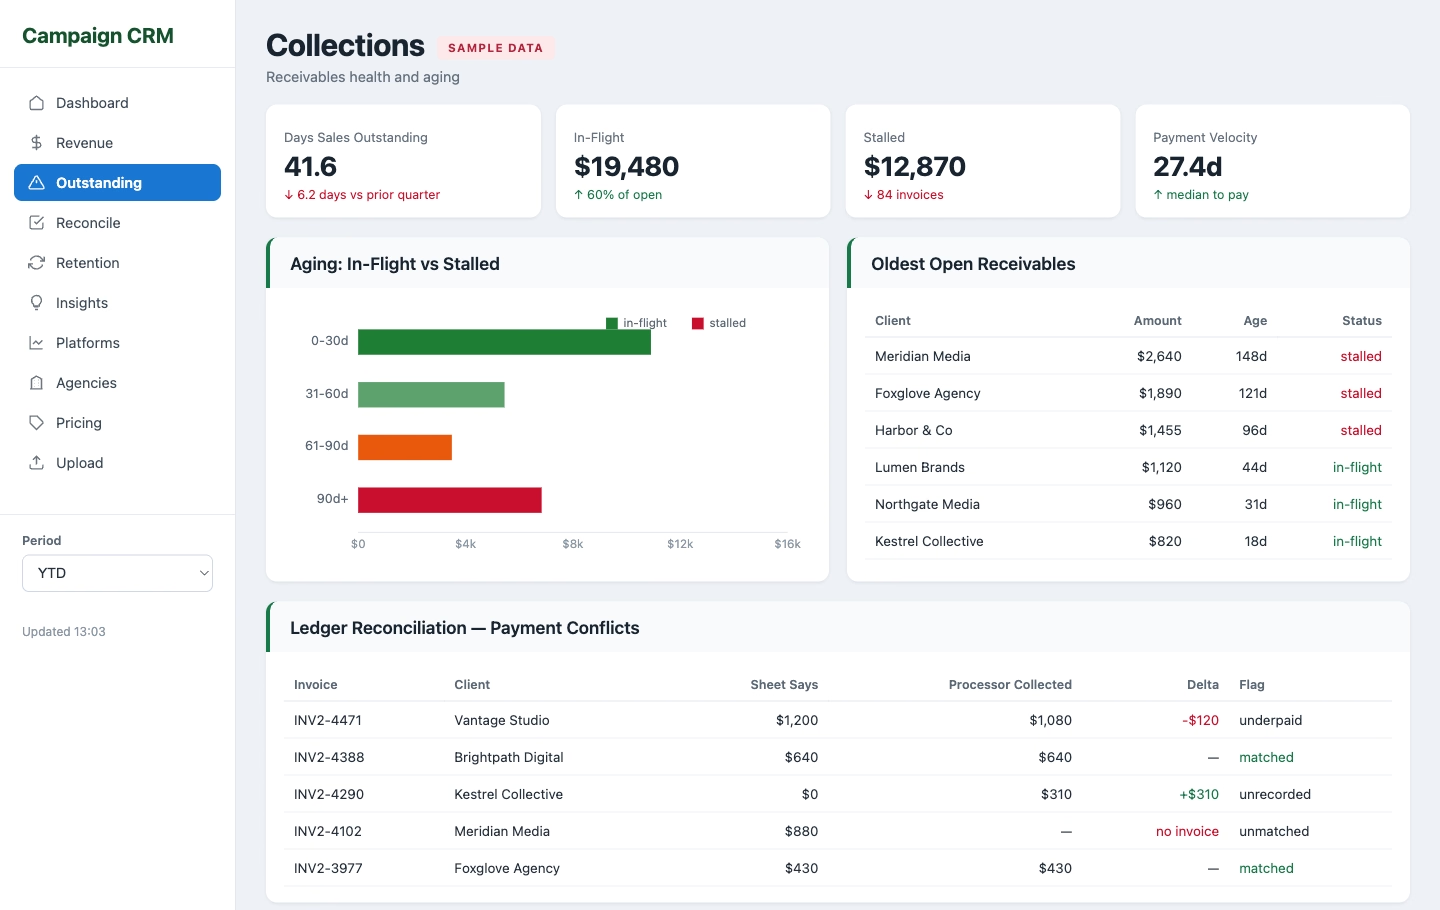
Every figure shown on this page is placeholder data. Real client names, rates, and revenue are not published here and never leave the machine the tool runs on.
The problem
This is the back office for a portfolio of content sites that run sponsored content and brand collaboration campaigns. A brand or its agency commissions a placement, the piece gets scheduled and published, an invoice goes out, and eventually it gets paid. Multiply that by several sites and six years and you have a real operations problem hiding inside what looks like a simple workflow.
A small business that has been operating for six years does not have a database. It has spreadsheets. One per year, each with slightly different columns than the last, because the business changed and nobody was thinking about future queries when they added a column.
That works fine for recording things and terribly for answering questions. “Who owes me money right now, and how long have they owed it?” is a question the spreadsheets technically contain the answer to and will not give you. Neither will “which clients stopped buying,” or “does my ledger actually agree with what the payment processor collected.”
Buying a CRM does not solve this either. Commercial CRMs want you to enter your business into their data model, and six years of history does not migrate cleanly into someone else’s assumptions. So the tool has to meet the spreadsheets where they are.
What I built
A local Dash application, roughly 5,200 lines of Python across ten pages, that reads the spreadsheets in place and does the analysis on top of them. Nothing is migrated. The spreadsheets stay the system of record, and the dashboard is a read layer over them with one upload page for refreshing the data.
It runs on the operator’s own machine and talks to no cloud service. For a tool whose entire content is client names, contact details, and payment history, local-only is not a limitation. It is the requirement.
Schema drift is the actual work
The oldest spreadsheets have a different shape than the newest. A column that was once split into two payment fields later became one. A field called one thing in year one is called something else by year four. None of that was wrong at the time.
So the loader carries a normalization layer that maps each year’s real columns onto a single internal schema before anything else runs. Every downstream page queries the normalized frame and never has to know which year a row came from.
This is the unglamorous majority of the codebase and the reason the rest of it is short. Analytics code that has to branch on data vintage becomes unmaintainable within about two years. Analytics code that runs on one clean schema stays readable indefinitely, and the entire cost of that is paid once, in one module.
Two clients with the same name are one client
The subtler problem is identity. Over six years the same customer appears under a personal name, a company name, a slightly different company name after a rebrand, and occasionally a colleague’s name. Counting those as four customers destroys every retention and lifetime-value number the tool produces.
Resolution works off email domain plus name normalization, which is the signal that actually stays stable when the display name does not. Everything that depends on knowing who a client is, retention, concentration, lifetime value, reads the resolved identity rather than the raw cell.
Reconciliation against the payment processor
The page I would build first if I built this again is the ledger audit, because it catches the errors that cost real money.
It pulls the invoice identifier out of each campaign row, reduces the payment processor’s export to one summary row per invoice, and joins the two. Then it reports two kinds of disagreement: rows where the spreadsheet’s recorded payment does not match what was actually collected, and invoice references with no matching invoice on the processor side. Both export to CSV so they can be worked through offline.
The audit is strictly read-only. It never writes a correction back into the spreadsheets. Automated reconciliation that silently “fixes” a financial record is a category of tool I will not build, because the failure mode is a quietly corrupted ledger that nobody notices for a year.
Collections, in-flight versus stale
Aging reports usually lump everything unpaid into buckets by age, which flatters the numbers. An invoice sent nine days ago and an invoice ignored for nine months are not the same thing, and averaging them produces a days-sales-outstanding figure that describes nothing real.
So the collections view separates receivables that are still moving from receivables that have stopped, and reports payment velocity alongside the aging. The practical output is a short list of who to chase and in what order, which is the only thing anyone actually wants from a collections screen.
The rest of the pages
Insights carries the strategic view: revenue split by new versus returning, client concentration expressed as top-N share, and a revenue forecast adjusted for seasonality. Concentration is the number worth watching in any small business, because losing one client is survivable and losing the client that is a third of revenue is not.
Retention finds accounts that have gone quiet past a configurable threshold, estimates win-back value, and drafts the outreach.
Pricing compares list rates against what was actually charged and surfaces the gap, which is usually larger than anyone expects.
Upload takes a dropped spreadsheet and refreshes the data, so the whole thing stays usable by someone who does not want to touch a terminal.
Dependencies are pinned, deliberately
Every dependency is pinned to an exact version rather than a floating range, and new versions are only adopted after a cooldown window has passed since publication.
That is the same supply-chain posture I apply across every project I run. Most malicious package versions are caught within hours of publication, so simply refusing to be first to install a release removes the large majority of that risk for free. On a tool that reads financial records on a machine that also holds production deploy keys, that trade is not close.
Why a spreadsheet-backed tool was the right answer
The instinct with a project like this is to migrate everything into a real database and build a proper application. That instinct is usually wrong for a business of this size.
Migration means a one-time conversion that will be subtly lossy, a new system the operator has to learn, and a permanent obligation to maintain a schema. Reading the spreadsheets in place means the operator keeps working exactly as before, the tool can be turned off tomorrow with nothing lost, and every number it produces can be traced back to a cell someone can go look at.
If your business runs on spreadsheets that have outgrown what a spreadsheet can answer, that is a solvable problem and it usually does not require throwing the spreadsheets away.
Like what you see?
I build tools that solve real problems. If you have an idea or a project that needs engineering, let's talk.
Get in Touch