Paddle Conditions | Water Sport Scoring App
Multi-platform paddle sport scoring system with a premium web app, Home Assistant integration, and 4,000+ verified water bodies. Real-time conditions from USGS, CDEC, NOAA, and AirNow combined into a single 0-100 score for every saved spot.

The problem
If you paddle in Sacramento, you know the routine. Open USGS for streamflow. Switch to Weather.gov for wind. Check AirNow for air quality. Pull up CDEC for reservoir levels at Folsom or Natoma. Add a tide chart if you are running the Delta. That is four or five browser tabs, and none of them speak to each other, and none of them tell you whether it is actually worth loading the kayak.
I built Paddle Conditions because I wanted one page, one number, one decision.
What I built
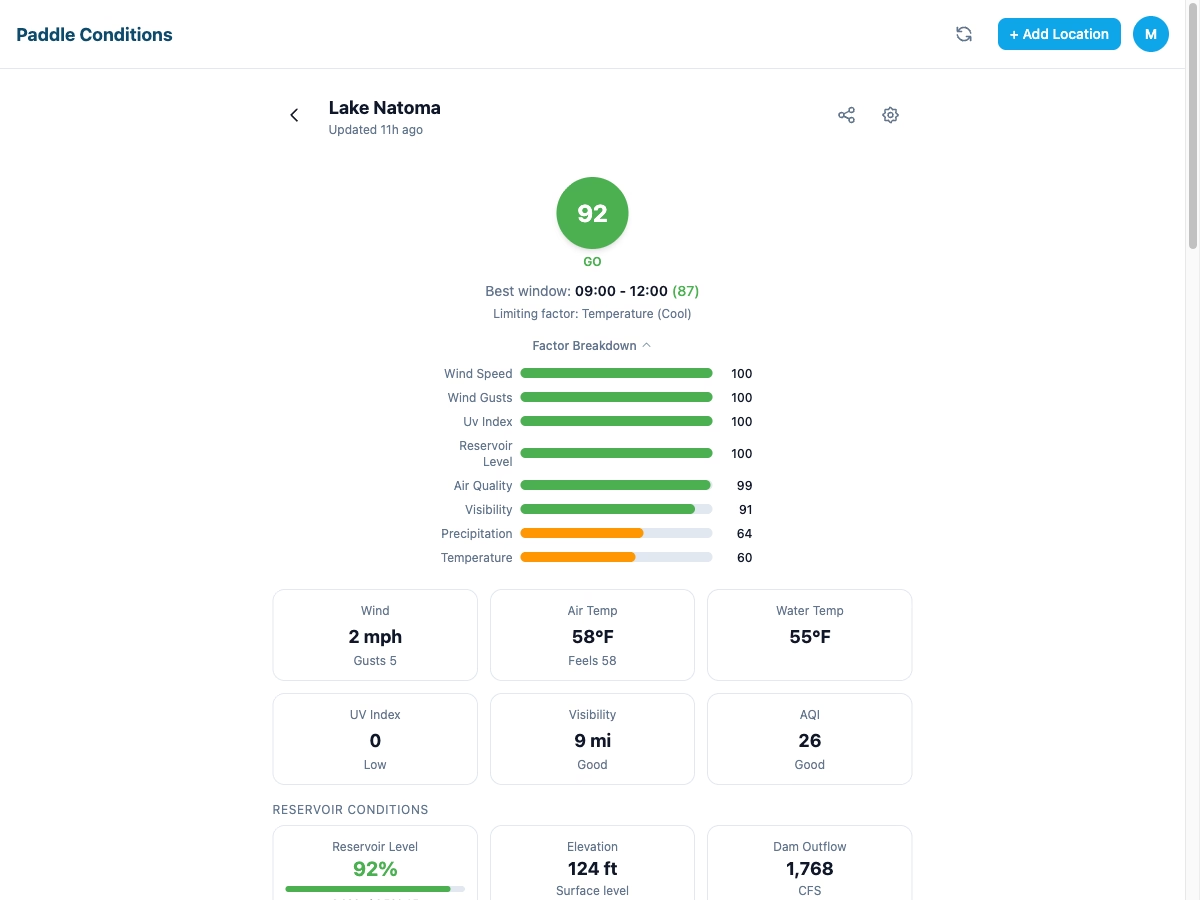
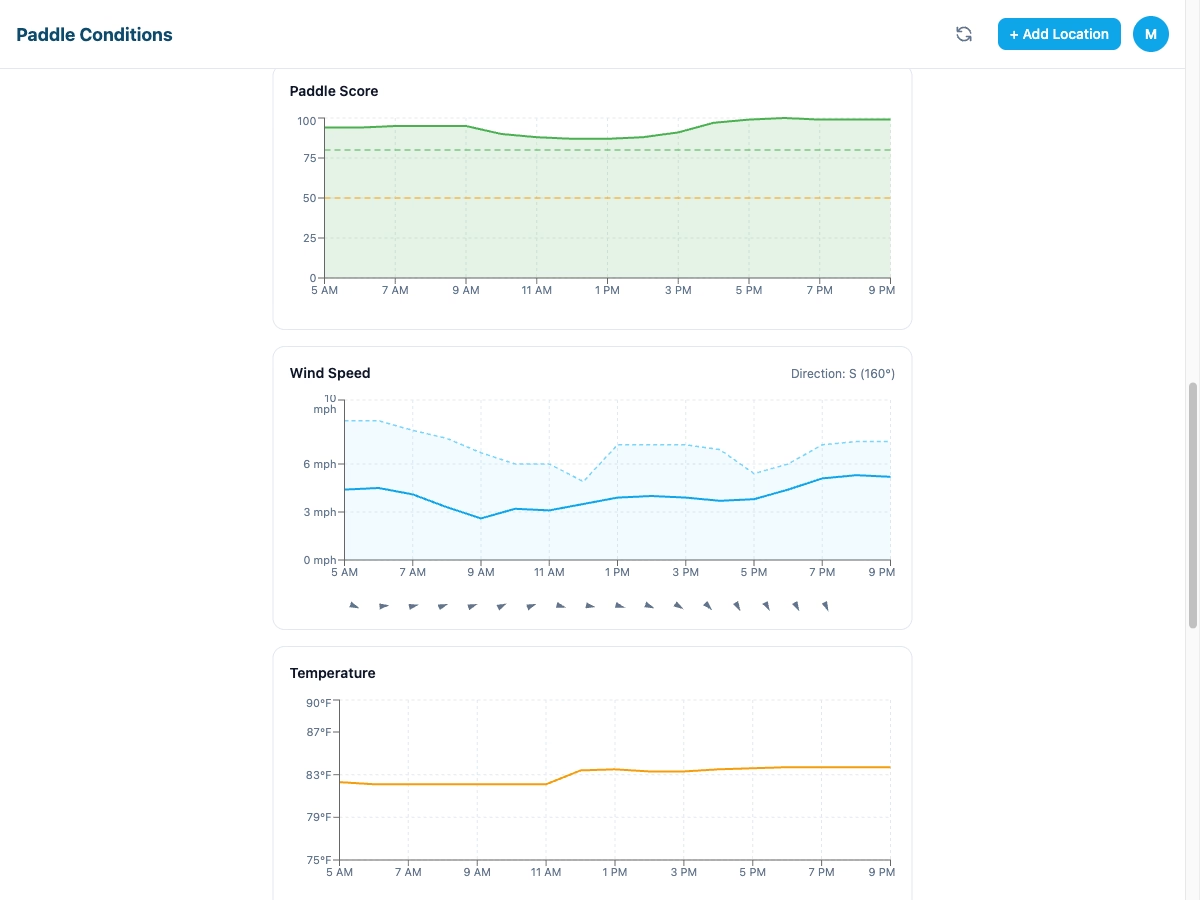
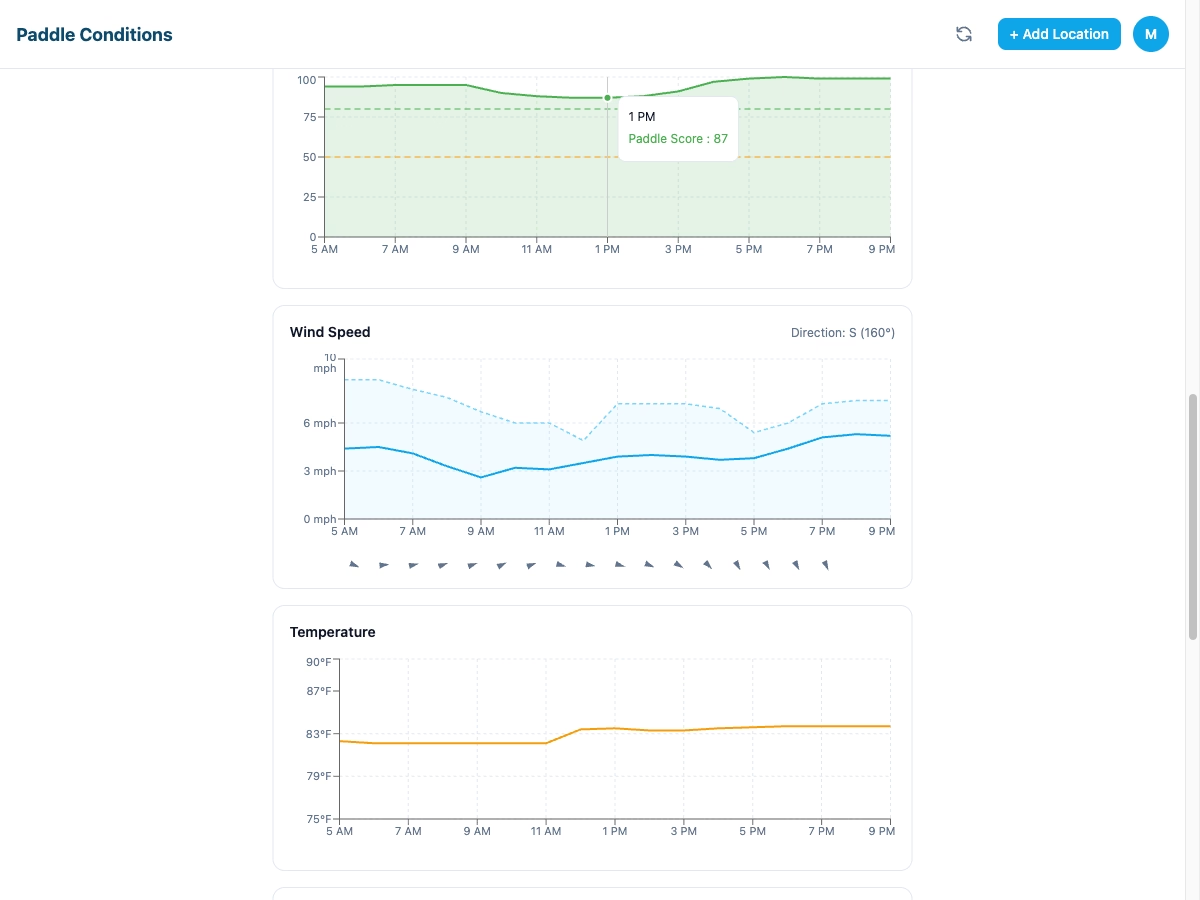
Paddle Conditions pulls real-time data from seven sources, combines it into a single 0-100 score adjusted for your activity, and tells you whether to go. Lake Natoma this morning scores a 92. Best window is 9 AM to noon. The limiting factor is water temperature at 55 degrees. That is the whole answer, on one screen, pulled fresh from the monitoring stations nearest to that spot.
The database covers 4,000+ verified California water bodies. Each one is linked to the right USGS gauges, CDEC reservoir sensors, and NOAA weather stations automatically, so when you save a spot the app already knows where to look.
The scoring algorithm
Seven factors feed the score, each weighted differently depending on the activity profile you pick. Wind matters more for stand-up paddleboarding than for touring kayak. Water temperature matters more for open-water swimming than for racing. Every factor gets a 0-100 sub-score, the weighted sum produces the final number, and the limiting factor bubbles up in plain language so you know exactly what to watch.
The factor breakdown UI shows this in real time. Wind speed is perfect at 100. Wind gusts, UV, reservoir level, and air quality are all at or near the ceiling. Visibility is at 91. Precipitation drops the score to 64 because there is a chance of rain later. Temperature drops it to 60 because the water is still cold. The final score of 92 is the weighted average.
How the data flows
Seven sources feed the backend. USGS streamflow gauges for rivers and discharge. CDEC reservoir sensors for storage, elevation, inflow, and outflow at every managed reservoir in California. CDEC water quality for temperature and clarity where the sensors exist. NOAA weather for wind, temperature, and visibility. AirNow for air quality index. NWS for the hourly forecast. Tide tables for the Delta and coastal spots.
The Fastify backend pulls all seven through a shared cache keyed by water body. Active spots (the ones someone saved or viewed in the last day) refresh every six hours. Low-traffic spots refresh daily. When a refresh is in flight, a stale-data indicator shows the age of the cached number so you know what you are looking at.
Three platforms, one backend
The same score and the same data feed three different interfaces. A premium web app at app.paddleconditions.com with saved spots, hour by hour charts, and Stripe billing. A Home Assistant integration published on HACS with 13 sensor entities per location and two custom Lovelace cards. A mobile app for iOS and Android (in development) with on-device storage for offline checks at the put-in.
Every frontend talks to the same Fastify backend and the same shared cache, so a refresh triggered by the Home Assistant integration benefits the web app user who opens the same spot two hours later. Build the core once, ship it everywhere.
Where it stands
The premium web app launched in March 2026 with Stripe billing and Apple IAP support. The Home Assistant integration hit v1.0.0 with Gold quality compliance on HACS, including full accessibility (keyboard navigation, screen reader, high-contrast colors). Full documentation covers every feature of the web app, the Home Assistant setup guide, and a running changelog that now includes Lake Oroville CDEC reservoir monitoring, public spot discovery pages, and interactive Leaflet maps on every water body.
The site scores under a second on mobile. The Sacramento paddling community uses it daily. And the pattern underneath it, a handful of public data sources combined into a single decision score, is the same pattern I build for any business whose customers are already checking four tabs to make one choice.
If your team or your customers are opening five websites before every decision, that is a dashboard waiting to exist.
Like what you see?
I build tools that solve real problems. If you have an idea or a project that needs engineering, let's talk.
Get in Touch